Calm comparisons that start with clarity
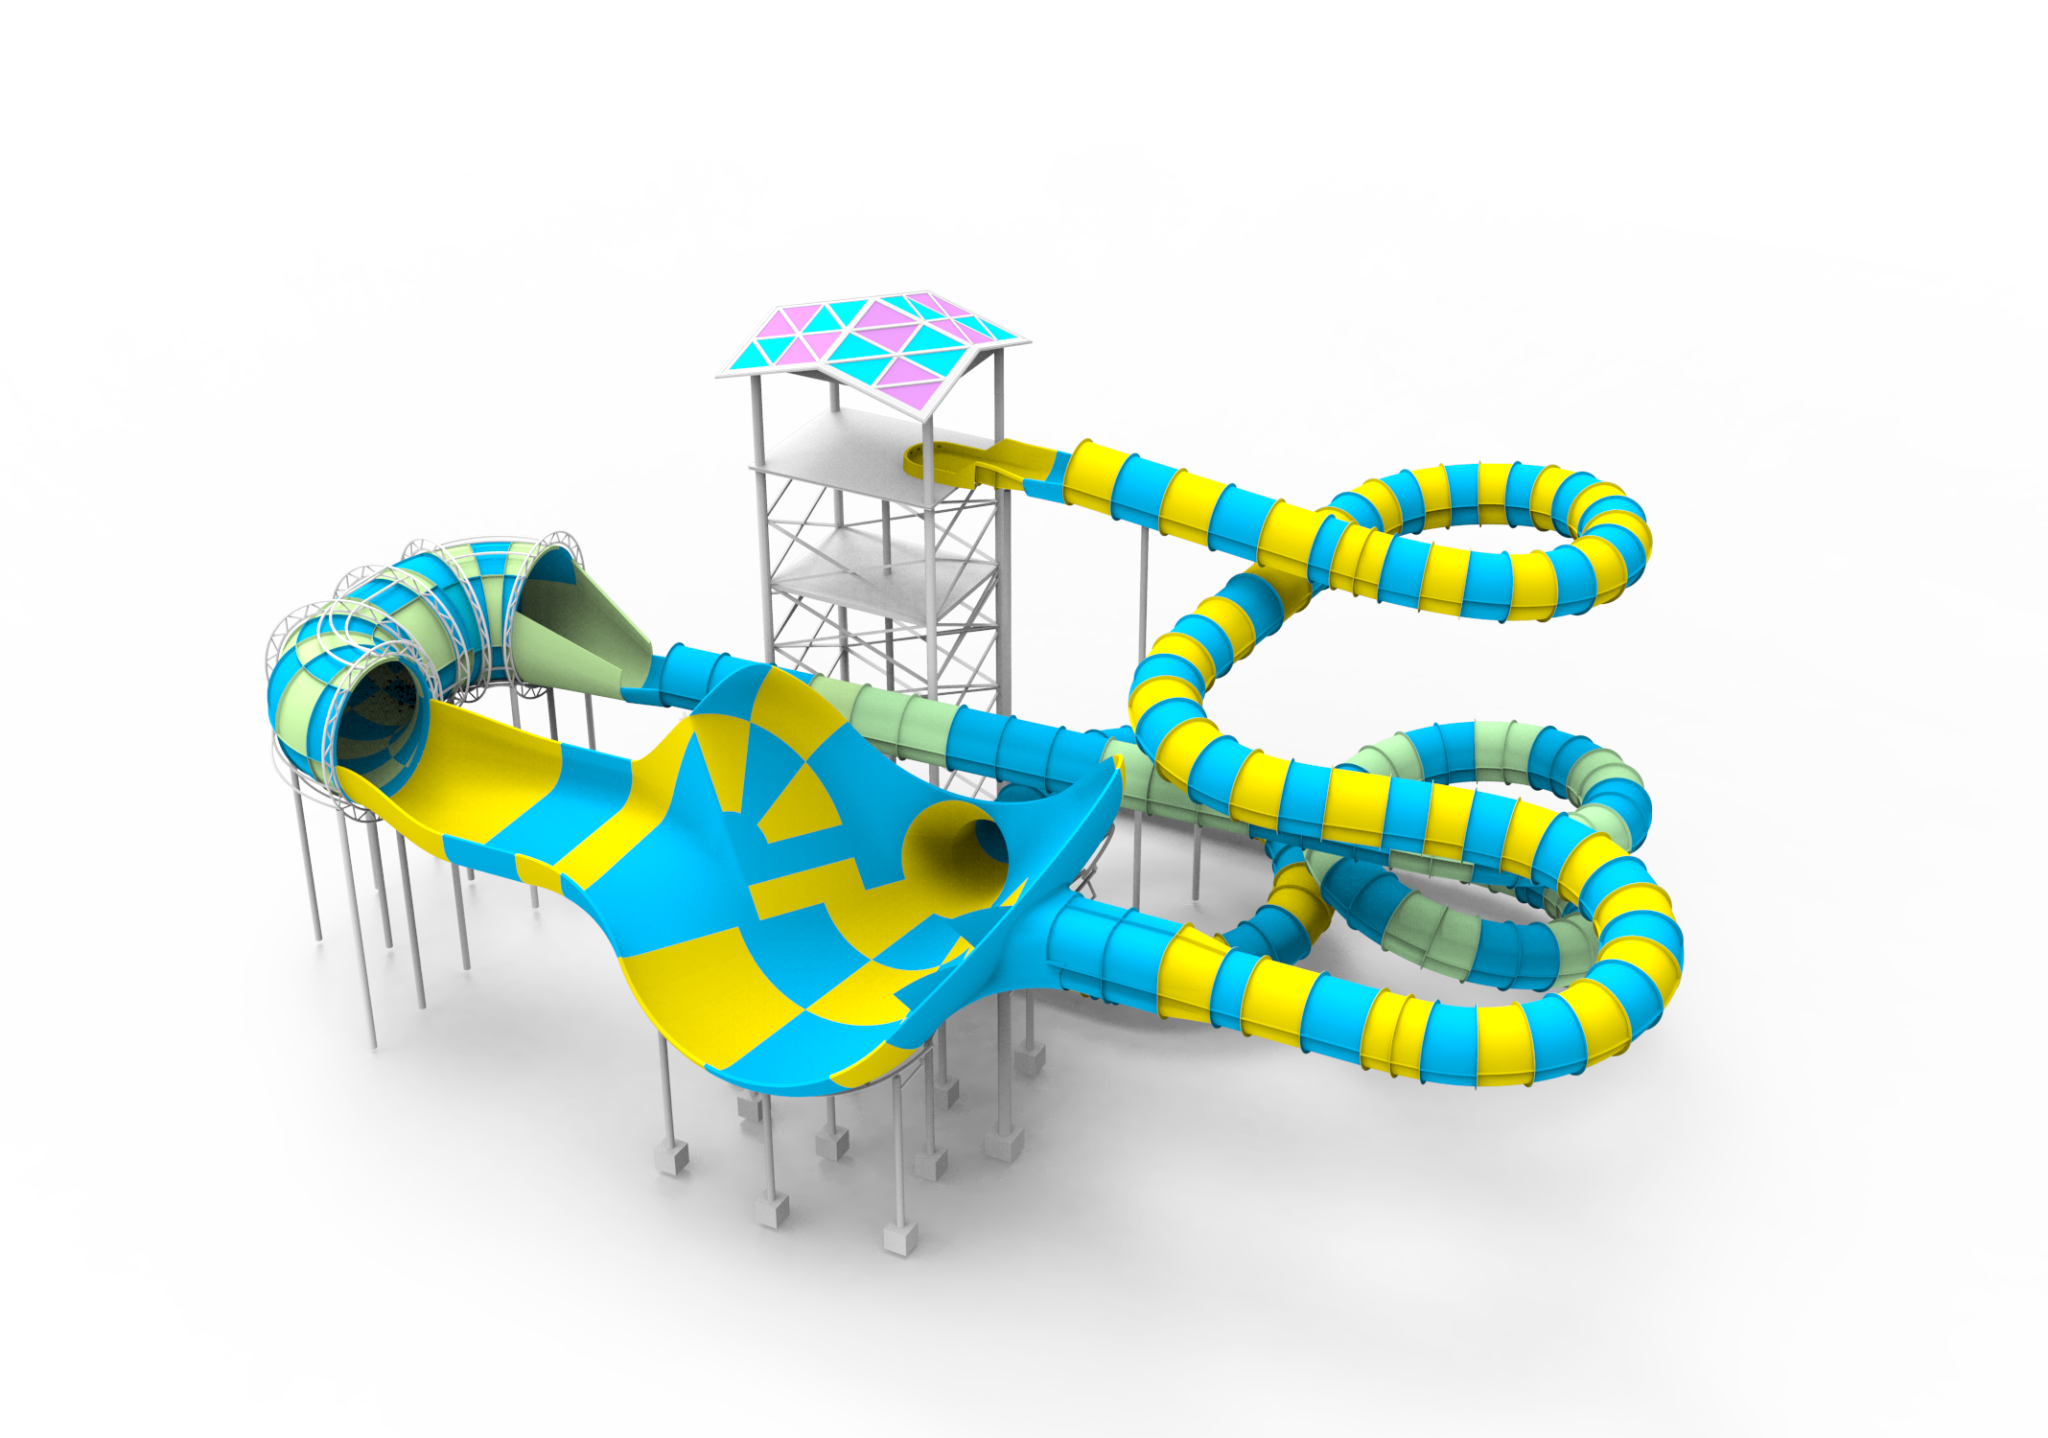
There’s a quiet logic to seeing guest movement as a system — one shaped by slide design, staffing rhythms, and the micro-choices made at each launch platform. In that light, a tornado water slide is not just an attraction; it’s a throughput mechanism that competes with conveyors, lazy rivers, and F&B lines for a resort’s real estate. Resorts such as Disney’s Typhoon Lagoon have long used signature rides to flatten peaks in attendance, showing how a single high-capacity flume can shift crowd patterns across a whole day.
Design choices: which slide types move the most people?
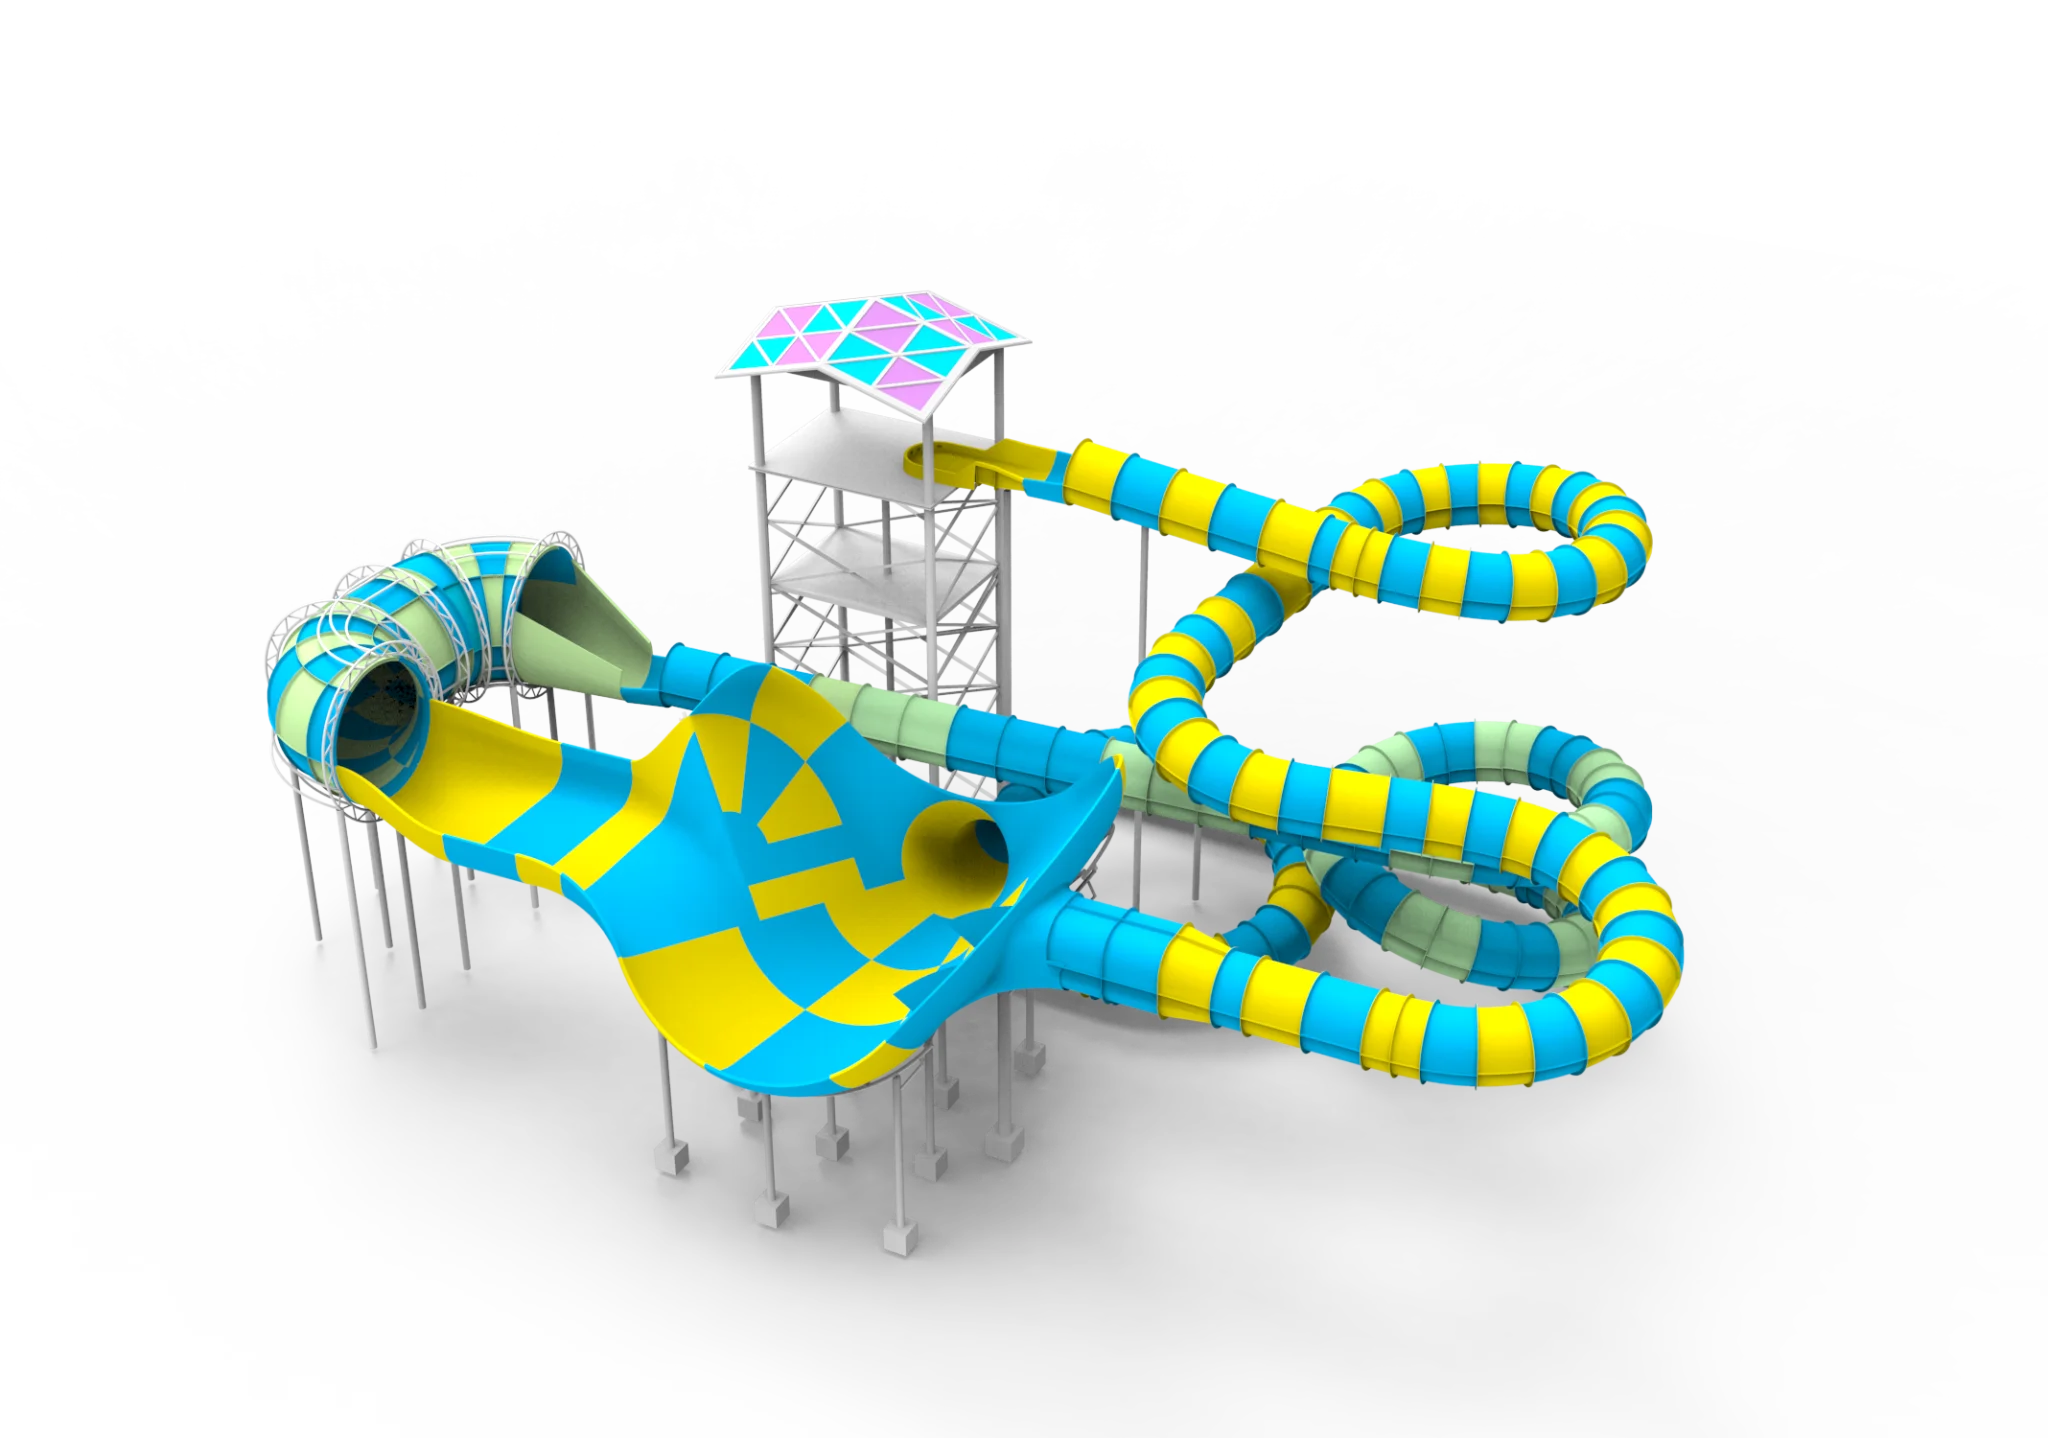
Comparing multi-lane racers, bowl/tornado models, and long tube runs reveals distinct trade-offs in dispatch rate, footprint, and rider experience. Multi-lane racers maximize simultaneous dispatch — lanes can be cycled every 20–30 seconds with trained staff — while bowl slides deliver spectacle and steady flow when combined with a rapid unloading zone. Material choice matters too: fiberglass water slides offer smooth surfaces and low friction, which helps maintain consistent ride times and predictable capacity.
Operations: staffing, queues, and small fixes that change the math
Operational tweaks often beat expensive redesigns. Lifeguard rotation, rider loading procedures, and pre-ride checks directly affect the rider dispatch interval and therefore hourly throughput. Implementing a brief, scripted load routine can shave seconds off every cycle — and seconds add up. Common mistakes that reduce capacity include:
– letting save-the-seat behavior swell queues;
– using one attendant across multiple lanes without cross-training;
– poor communication between launch and splashdown zones.
Train crews in synchronized dispatch, set clear queueing lines, and use visual cues at the launch platform to keep flow steady — small operational discipline yields measurable gains.
Comparing lifecycle costs: build, maintain, and replace
High-capacity slides demand attention to maintenance cycles and inspection regimes. Fiberglass flumes are popular because they resist corrosion and require fewer resurfacing cycles than some alternatives; that lowers downtime and boosts effective capacity over a season. Expect a mature high-capacity unit to range in effective throughput from roughly 600 to 1,200 riders per hour depending on dispatch protocol and rider mix — a useful benchmark when weighing capital cost against seasonal guest load.
Guest experience versus raw throughput
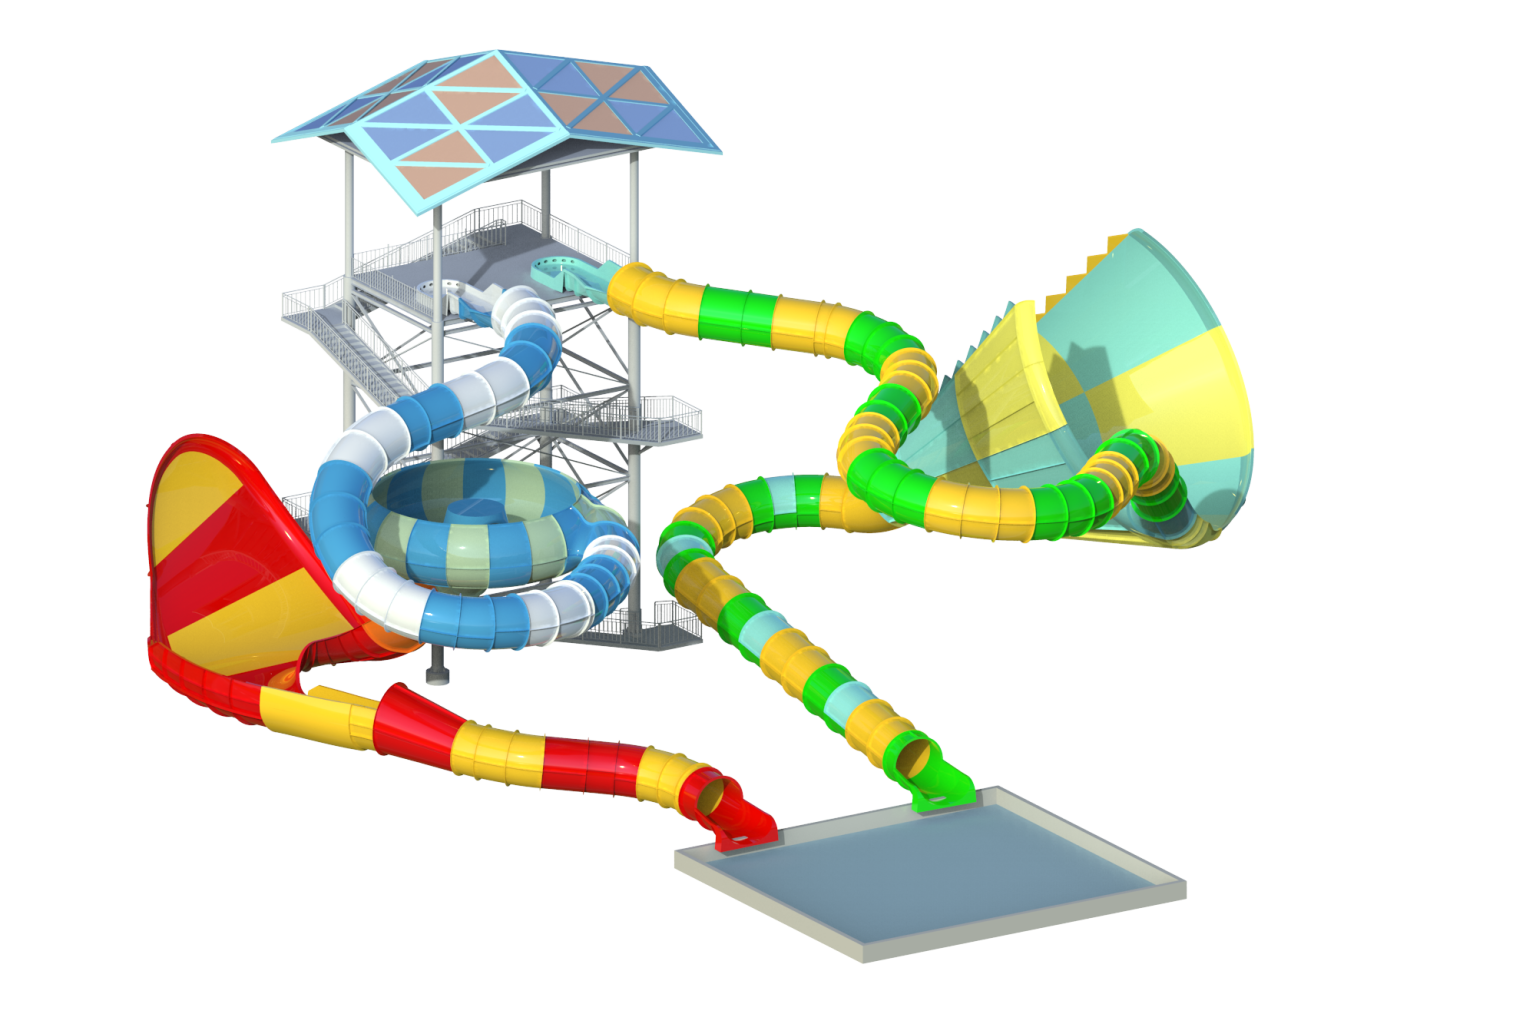
Some resorts mistakenly optimize only for maximum dispatch numbers and lose the moment that makes a water park memorable. A reflective balance is needed: preserve a signature ride’s sensory impact while tightening the operational side so queues move at a humane pace. Design for easy sightlines to the splashdown pool, and plan evacuation protocol that’s efficient without being intrusive. The result favors steady throughput and repeat rides — which, in turn, spreads demand more evenly across the park.
Advisory: three golden metrics for choosing the right approach
1) Peak-to-average ratio: Measure your busiest hour vs. daily average. If peaks exceed capacity by more than 30%, pick slides with higher dispatch rates or add adjacent attractions to siphon demand.
2) Effective uptime: Track the percentage of operating hours the slide is open and fully staffed. Aim for 90%+ during season; anything lower signals maintenance or staffing shortfalls.
3) Average dwell per rider: Record the time from queue entry to return-to-queue. Shorter cycles mean higher throughput and better guest sentiment. These three metrics give a clear, actionable picture of how a slide performs beyond its nominal capacity.
Adopt designs and operational rules that fit your guest profile — then measure, adjust, repeat. Dalang