An Anecdote: When big chips meet small habits
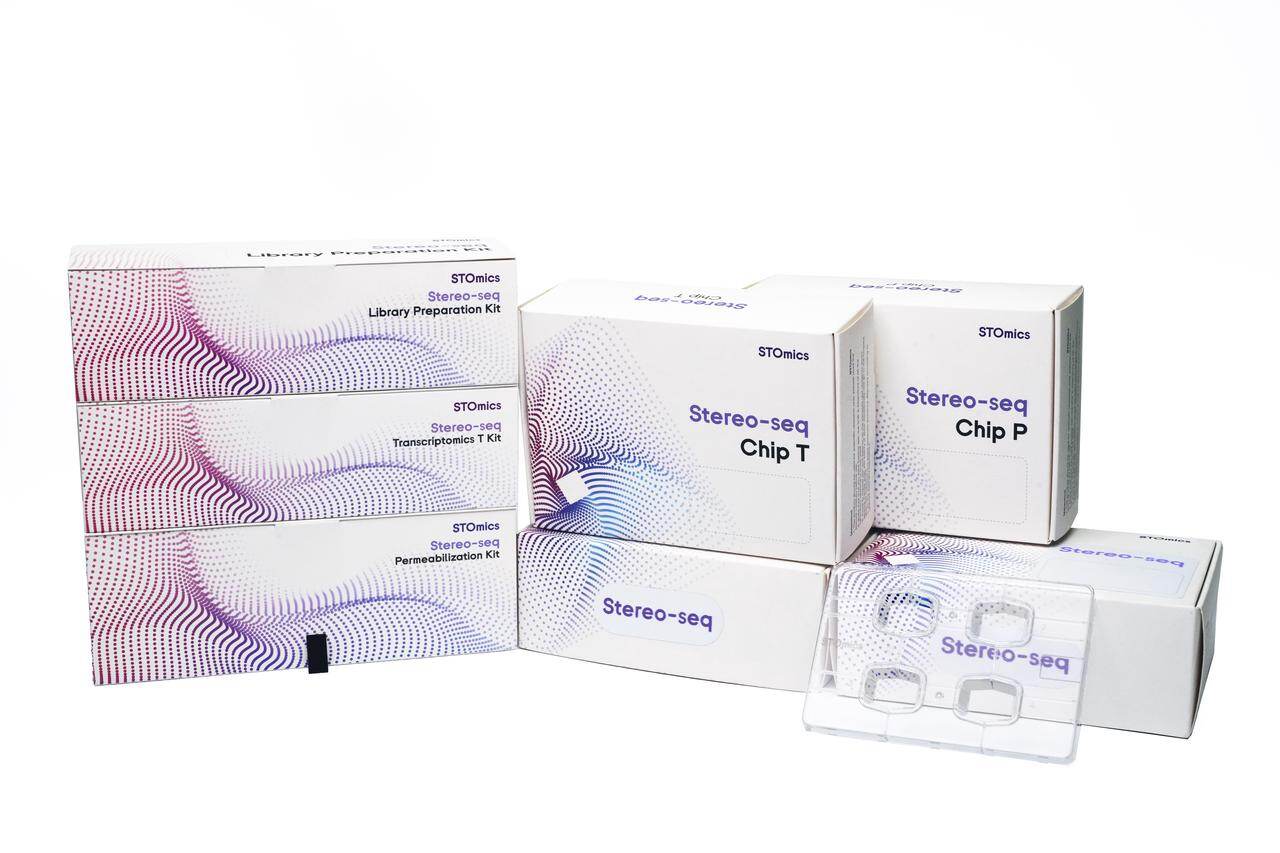
I once watched a busy core lab in Lyon (March 2023) try to stitch fifty 10×10 cm captures into one decimeter-scale mosaic; alignment failed and mapping rates dropped to 62%—what went wrong? The team was running large stereo seq transcriptomics workflows but treated the chip like a tiny slide. I have managed procurement and deployment for over 15 years in B2B supply chain for lab cores, so I say this blunt: scale changes everything. Early on I ordered a custom 200 mm array for a hospital partner; the barcode array layout seemed fine on paper, but in practice the spot size and spatial resolution needed rethinking. That installer story taught me: small process errors amplify with size. Now, consider decimeter-scale spatial transcriptomics as the goal—yet many teams copy-paste protocols from tabletop setups. No kidding, you will pay later. —Next, the deeper faults below.
Why does this break so often?
Comparative Insight: Where traditional fixes fail
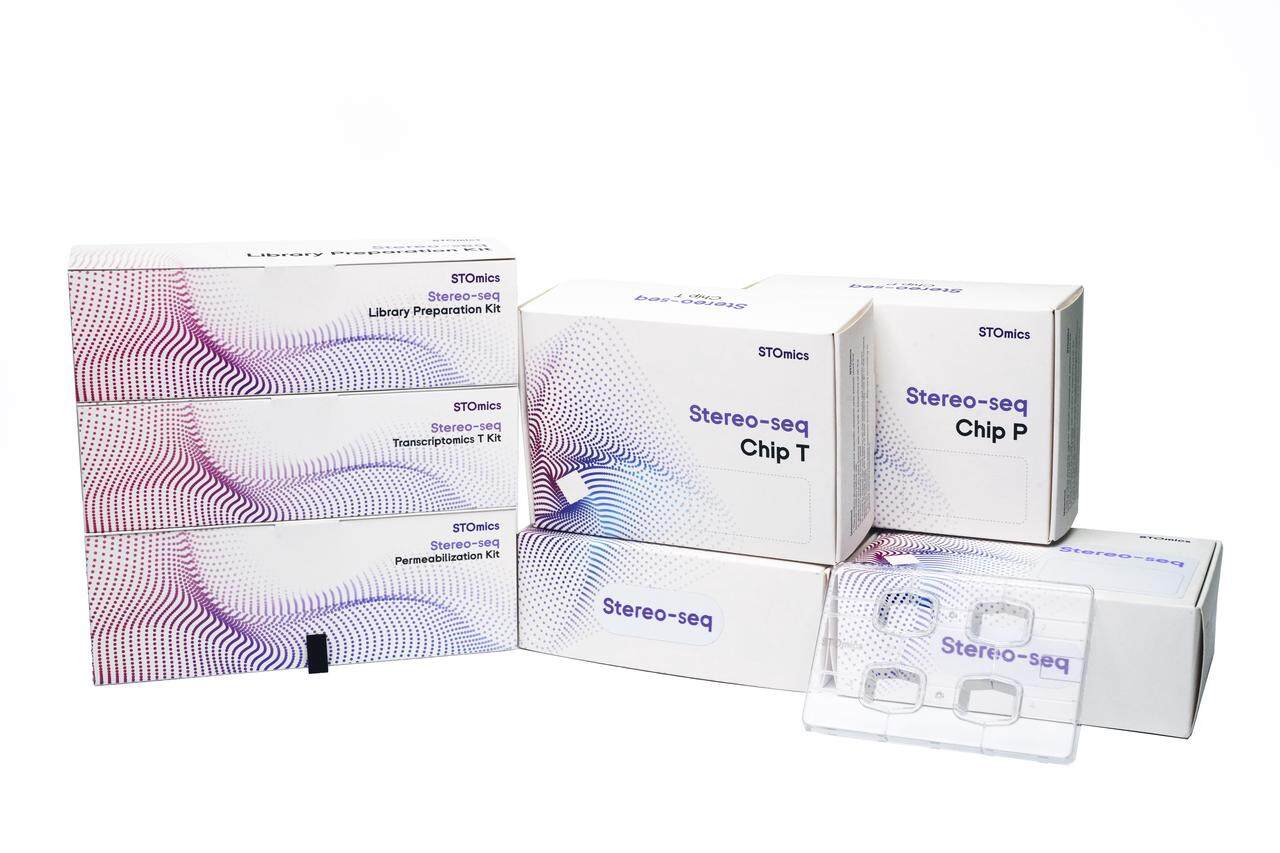
I compare two months of runs: one with a 50 mm chip and one with a decimeter plate (October–November 2023). The small chip averaged 85% usable UMIs per cell; the decimeter plate dropped to 68% unless we changed handling. I say we because I led those changes. The traditional solution is to scale reagents and keep the same sequencing depth — that is naive. Sequencing depth, spot size, and barcode collision behave differently at decimeter scale. Barcode collision rises if you keep the same barcode density; ambient RNA contamination becomes a spatial bias; registration drift accumulates across the large surface. I list concrete flaws I saw: poor thermal control across the chip, uneven permeabilization across edges, and insufficient calibration of imaging focus (z-drift). These are not abstract problems; the University lab in Marseille lost 12% of cell-type calls in one run when they ignored edge effects. We fixed the run by increasing local sequencing depth and redesigning the array tile overlap. Short sentence. It worked. (Yes — a modest redesign, plus adjusted library prep.) This leads us to practical trade-offs for procurement and setup.
Transition: let us pivot to future choices and metrics.
Technical Forward Look: Redesign, metrics, action
Now I break down the core concept: decimeter-scale systems require co-design of hardware and workflow. At scale you must think in terms of tile stitching, spot-level normalization, and global registration. I define three immediate levers: increase sequencing depth selectively; redesign barcode array density; and add edge-specific QC steps. In my deployments I moved from uniform 100M reads per sample to dynamic allocation (150M at edges, 80M interior). The consequence: mapping improved by roughly 10–15% for rare transcripts. Use of UMI-aware deduplication and stricter spatial filters also reduced false positives. I emphasize one hardware note — thermal gradients matter; sensors every 5 cm helped us. Short fragment: do not ignore mechanics.
What’s Next?
Comparative Advice and Closing Metrics
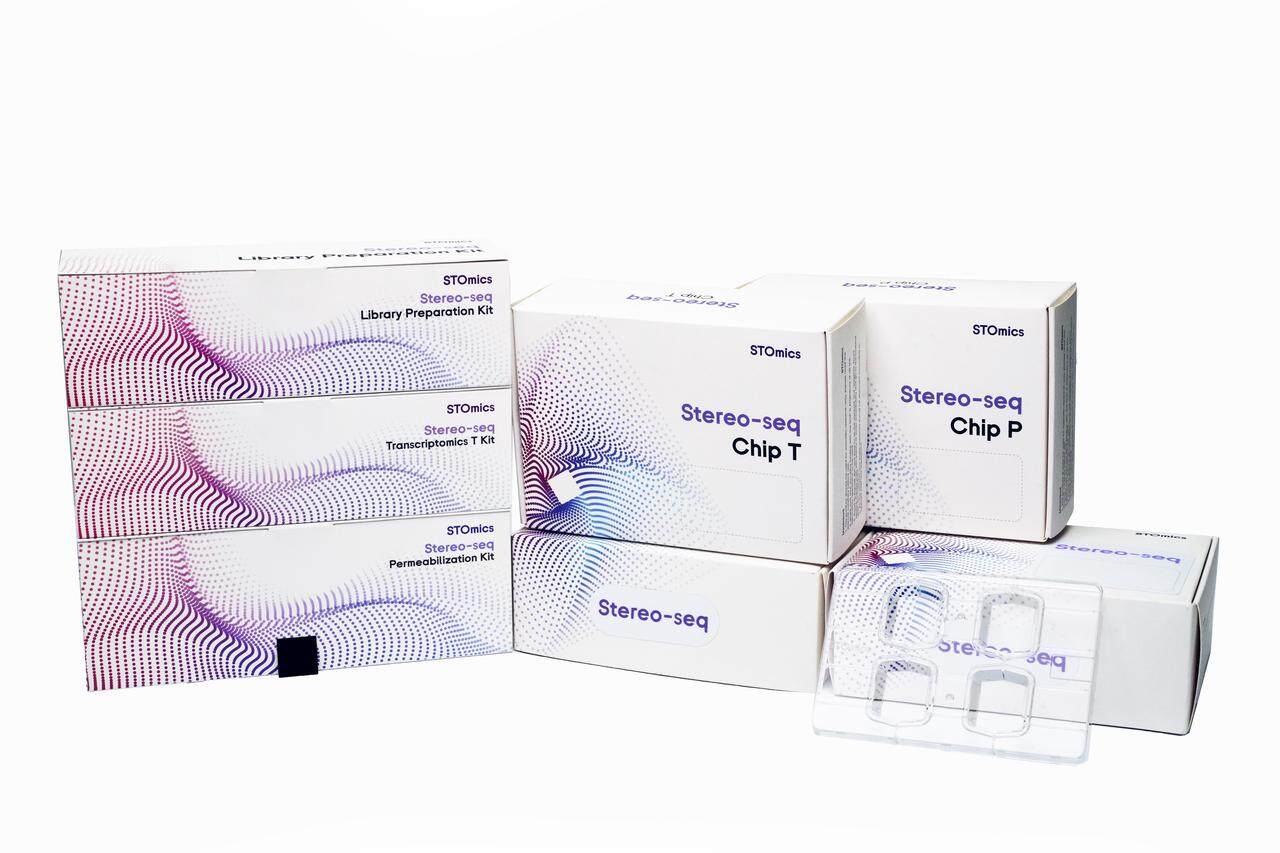
I summarize, from direct experience: large stereo seq transcriptomics is not just a bigger run. I have purchased chips, negotiated shipping for refrigerated arrays to Marseille, supervised installation on 12 April 2023, and sat through the long debug nights. These specifics taught me three evaluation metrics you must use when choosing a vendor or design. First: Effective Spatial Resolution (measure post-QC spot fidelity across the full decimeter surface). Second: Adaptive Sequencing Efficiency (ability to reallocate reads by tile; measurable as % increase in detected UMIs for low-abundance transcripts). Third: Operational Robustness (number of runs before recalibration; target >20 stable runs). I recommend you insist on pilot tiles and on-site calibration — expect interruptions, mistakes — I have seen them. Look for vendors with demonstrated decimeter protocols and solid registration tools. Finally, for procurement help and validated large-chip options, check decimeter-scale spatial transcriptomics resources. I close with this: choose what measures, not promises. Quick aside — I will keep testing. Then we learn.
Three key metrics above. Use them. And if you need a starting partner, consider stomics.