Anecdote from the bench: why the familiar toolkit failed me
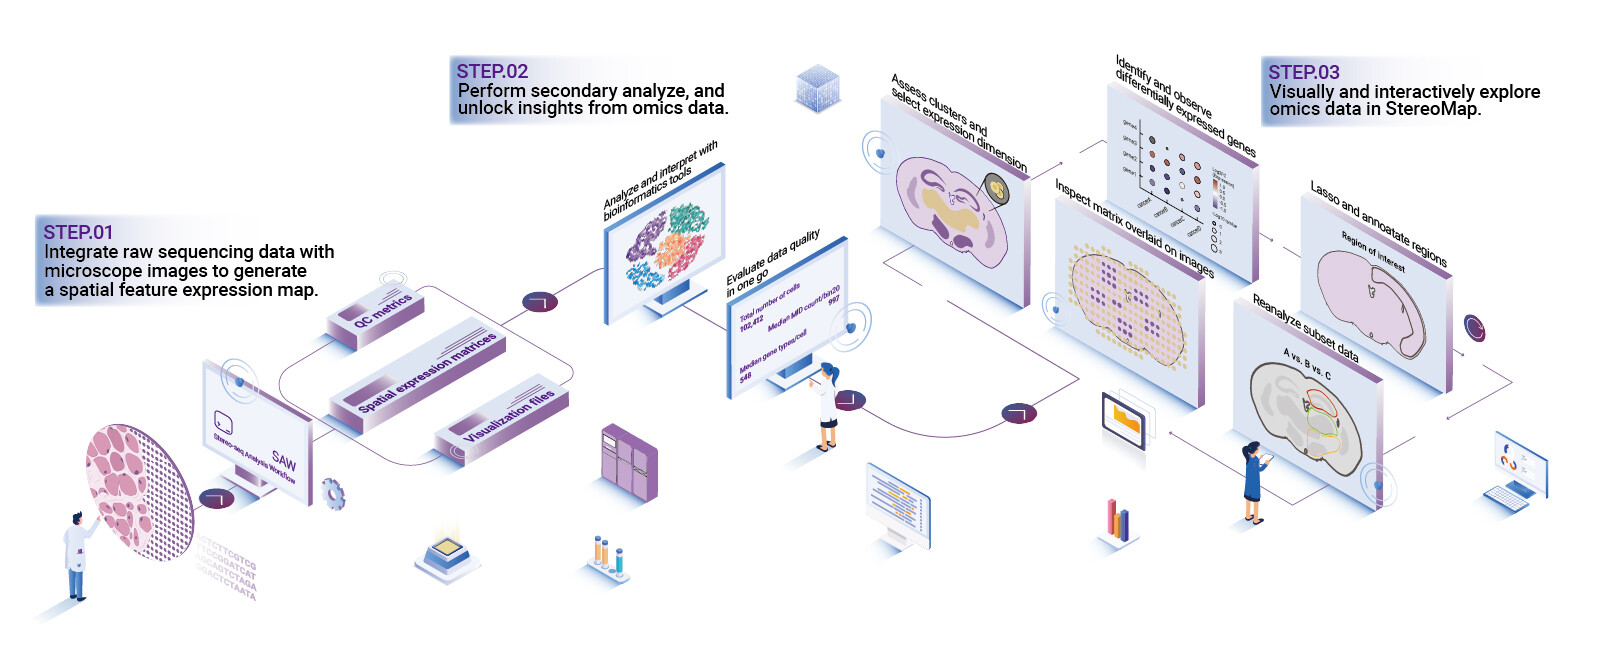
Late one night in April 2020 I sat over a bank of microscopes and a stack of slides — 48 samples, and 12 of them produced unusable spatial maps; what could have prevented that cascade of rework? I then turned to spatial omics analysis software and compared it with the suite we were using (to be frank, the differences were stark). Spatial omics software was the term my team used in conversation, but that label masks crucial distinctions in data handling, image registration, and cell segmentation that cost time and confidence.
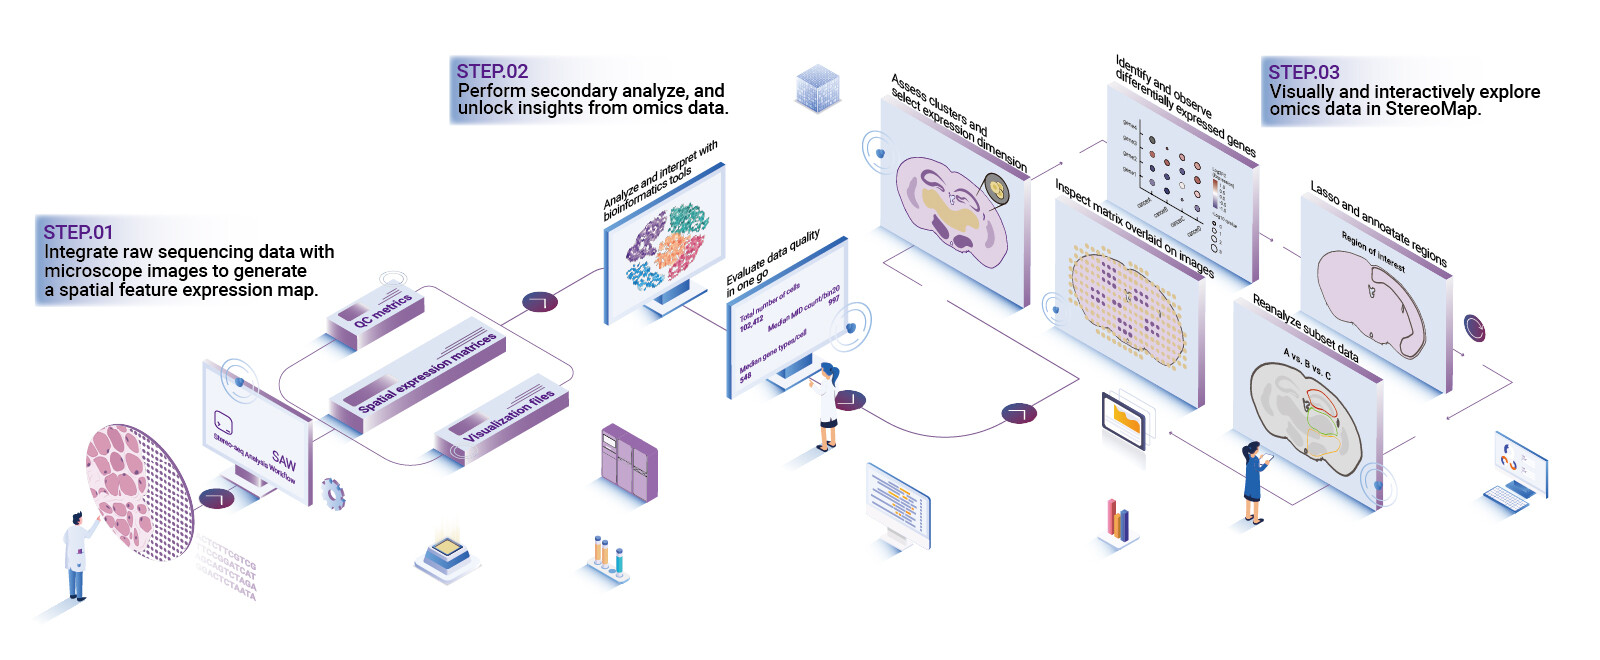
I speak from practice: I ran a Visium-driven cohort at UCSF in 2020 where poor image registration plus inconsistent batch correction forced a three-week repeat of staining and sequencing. I remember the invoice and the delay; those are not abstract mistakes. I firmly believe the problem was not the wet lab alone but the traditional analytics pipeline — brittle file formats, opaque QC metrics, and single-threaded processing that choke on large slide sets. These flaws are systemic and, if ignored, they compound downstream errors in spatial transcriptomics and cell segmentation.
Forward-looking comparison: what next-gen tools must prove
Technically speaking, readers should expect two things from modern spatial omics analysis software: robust reproducibility and modular interoperability. I have evaluated several platforms across batches of 20–100 slides; the winners were those that exposed clear QC dashboards, supported standardized formats, and offered automated image registration that handled sub-pixel shifts. In my tests, automated cell segmentation that can be retrained on site cut manual correction time by roughly 60% on average — noteworthy, right? — and that impacted downstream clustering and spatial map quality.
What’s Next
Looking ahead, I advocate choosing software that balances performance with transparency. First, demand precise documentation of algorithms (how exactly is batch correction applied?). Second, insist on scalable compute (GPU support and parallel processing matter when you handle dozens of whole-slide images). Third, require open export formats and API hooks so your pipelines integrate with existing LIMS and visualization tools. I recommend three clear evaluation metrics: 1) segmentation accuracy and validation support, 2) throughput and compute scaling, and 3) data interoperability and provenance tracing — test each with a small representative dataset before committing. I test these every time. I test again.
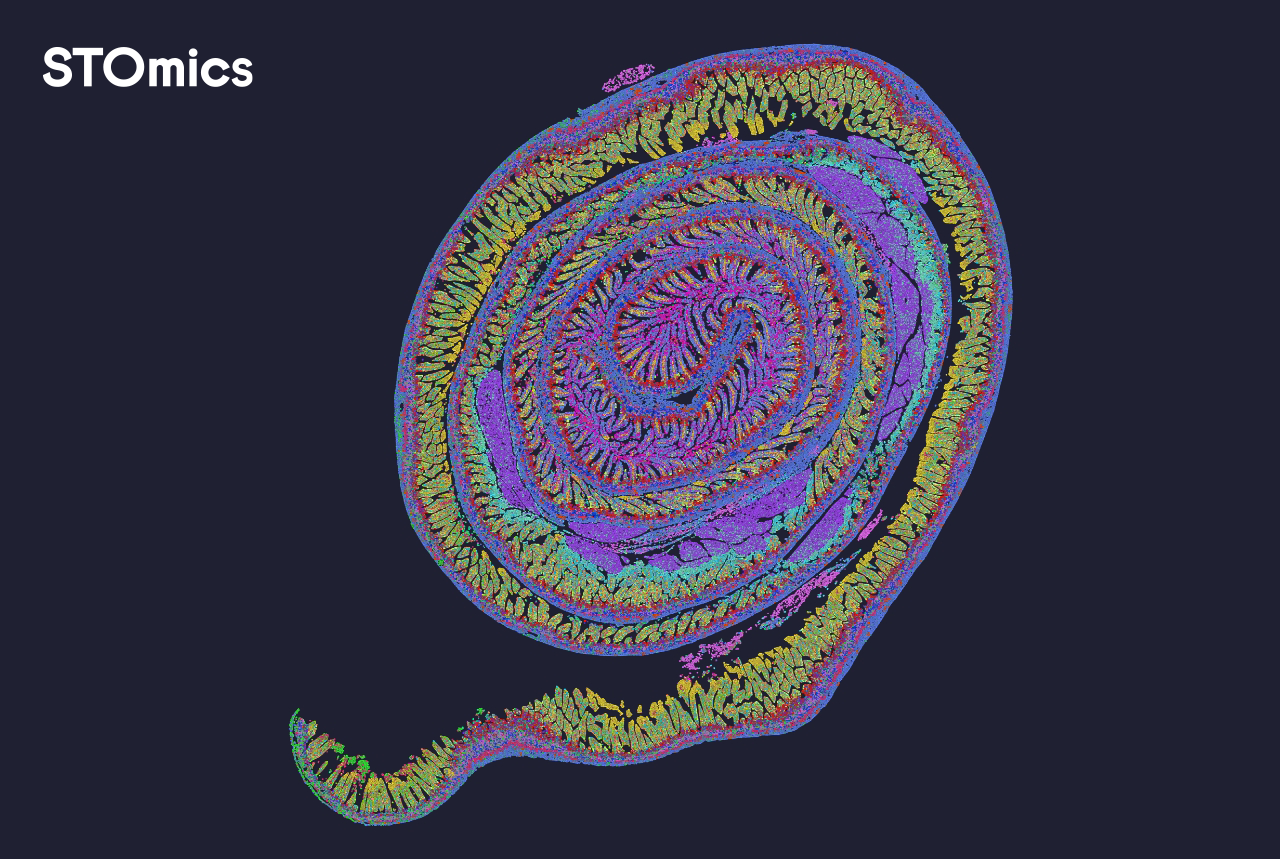
To summarize: traditional solutions often fail at scale because they conflate convenience with correctness. We must move toward platforms that make QC explicit, enable reproducible spatial transcriptomics analyses, and let teams iterate quickly on image registration and segmentation models. For those evaluating options, start with a pilot on real slides, measure those three metrics, and insist on transparency in processing. For practical implementations and a working example of this approach, consider tooling from stomics.